

2016 Election Day Drinking Behavior as Surprising as the Presidential Election Results
BACtrack® data shows Americans had of the lowest average BAC (Blood Alcohol Content) levels of the year at 0.038%; Blue and Red state average BACs were nearly identical.

Given the emotional rollercoaster ride of this presidential campaign, Clinton’s anticipated victory, and the fact Google Trends reported a 220% increase in searches for “election drinking game” on Election Day, we expected to see higher than average BAC (Blood Alcohol Content) levels across the U.S. on November 8th.
Here’s are some highlights from what we found. See the full BACtrack Consumption Report on our site.
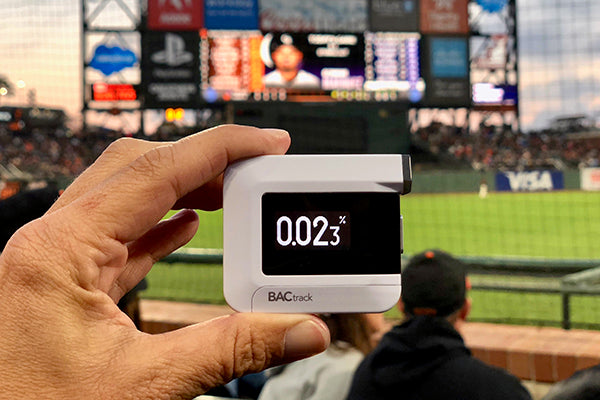
Average BAC levels for Election Day were at an all-time low at .038%
- Results were lower than the average BAC for all Tuesdays in 2016 (0.043%) and among the lowest of the entire year to date.
- What does this all mean? Americans were glued to their flat screens eagerly awaiting results in the close race; nobody was celebrating a winning candidate.
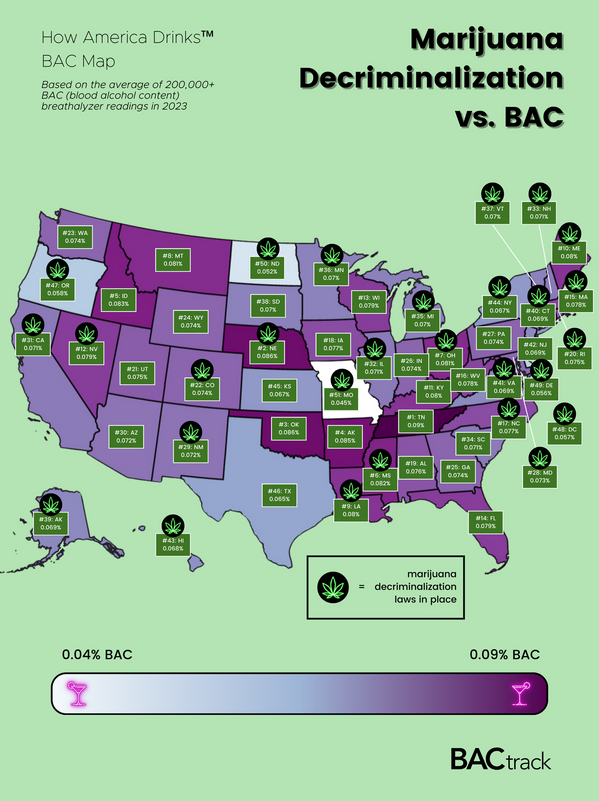
Just as the election was close, so were average BAC levels in Red and Blue States
- The average BAC for Red States (0.039%) is nearly identical to the average BAC for Blue States (0.037%).
- In the past, we’ve looked at average BACs by state and by major U.S. holidays and at average BAC levels for NFL fans and more, and never have results been so similar. Is this our first sign Americans will “come together as one united people”?
See the full BACtrack Consumption Report on our site, where you'll also see BACtrack breathalyzing Hillary and Trump fans at the DNC and RNC. Check out links to our past BACtrack Consumption Reports here too.
'/%3E%3Cuse xlink:href='%23a' transform='rotate(-72)'/%3E%3Cuse xlink:href='%23a'/%3E%3Cuse xlink:href='%23a' transform='rotate(72)'/%3E%3Cuse xlink:href='%23a' transform='rotate(144)'/%3E%3C/g%3E%3Cg id='c'%3E%3Cuse xlink:href='%23b' x='-.252'/%3E%3Cuse xlink:href='%23b' x='-.126'/%3E%3Cuse xlink:href='%23b'/%3E%3Cuse xlink:href='%23b' x='.126'/%3E%3Cuse xlink:href='%23b' x='.252'/%3E%3C/g%3E%3Cg id='d'%3E%3Cuse xlink:href='%23c' x='-.063'/%3E%3Cuse xlink:href='%23b' x='.315'/%3E%3C/g%3E%3Cg id='e'%3E%3Cuse xlink:href='%23d'/%3E%3Cuse xlink:href='%23c' y='.054'/%3E%3Cuse xlink:href='%23d' y='.108'/%3E%3Cuse xlink:href='%23c' y='.162'/%3E%3C/g%3E%3Cg id='g'%3E%3Cuse xlink:href='%23e' y='-.216'/%3E%3Cuse xlink:href='%23e'/%3E%3Cuse xlink:href='%23d' y='.216'/%3E%3C/g%3E%3Cpath id='f' fill='%23B22234' d='M0 0h1235v50H0z'/%3E%3C/defs%3E%3Cpath fill='%23FFF' d='M0 0h1235v650H0z'/%3E%3Cuse xlink:href='%23f'/%3E%3Cuse xlink:href='%23f' y='100'/%3E%3Cuse xlink:href='%23f' y='200'/%3E%3Cuse xlink:href='%23f' y='300'/%3E%3Cuse xlink:href='%23f' y='400'/%3E%3Cuse xlink:href='%23f' y='500'/%3E%3Cuse xlink:href='%23f' y='600'/%3E%3Cpath fill='%233C3B6E' d='M0 0h494v350H0z'/%3E%3Cuse xlink:href='%23g' transform='matrix(650 0 0 650 247 175)'/%3E%3C/svg%3E)
